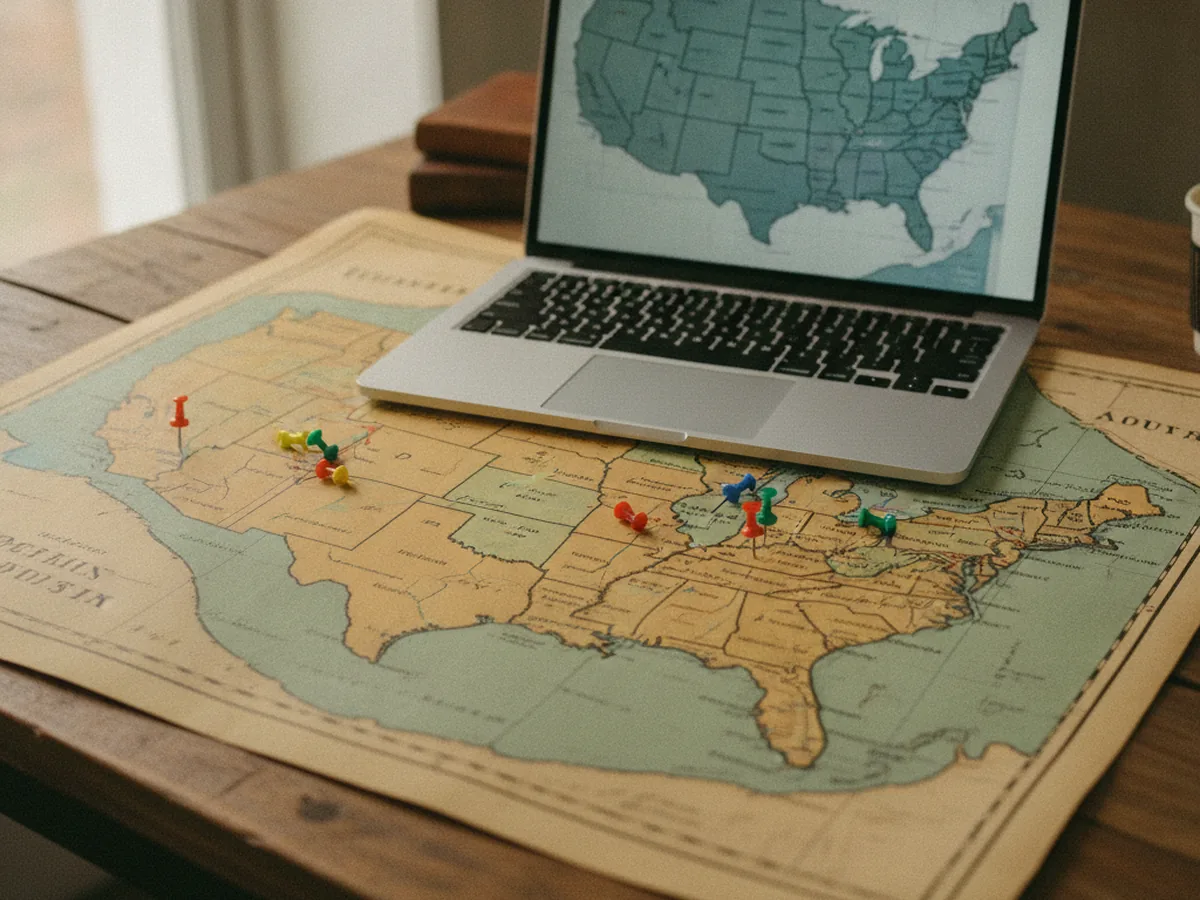
Place is one of the most useful ways into a collection. A photograph was taken somewhere. A letter was sent from one town to another. A ship sailed between two ports. When that information is structured, a collection can be explored on a map, and patterns appear that a list never shows.
Mapping is also one of the easiest digital humanities projects to start badly. Place names are ambiguous, historical boundaries move, and a pin on a map looks more certain than the evidence behind it. This guide covers the parts that matter: geocoding, gazetteers, uncertainty and simple interfaces.
Place already lives in the record
Most collections already carry geographic information. It sits in subject headings, in Dublin Core coverage fields, in captions and in folder titles. The problem is that it is written for people, not machines. "Monteagle, Tenn." and "Grundy County, Tennessee" may refer to the same area, and neither has coordinates.
Crosswalking is the first step. The MetaScholar Initiative built the Metadata Migrator in the 2000s to help museums, archives and small libraries map local fields into Dublin Core and share them through OAI-PMH. The same discipline applies to place. Decide which local fields hold geographic information, map them to one consistent field, and only then think about coordinates.
The Highlander Folk School photographic history is a good example of place-rich material. Its captions describe workshops, gatherings and events tied to specific locations in Tennessee and beyond. Collections like this reward a map view, as long as the underlying description is consistent.
Geocoding with gazetteers
Geocoding turns a place name into coordinates. The safest way to do it is through a gazetteer, an authoritative list of places with identifiers, names, types and locations. Linking to a gazetteer identifier is better than storing bare coordinates, because the identifier carries the reasoning with it.
Common choices include:
- GeoNames, a large open gazetteer of modern places with stable identifiers.
- The Getty Thesaurus of Geographic Names, built for cultural heritage description and strong on historical names and hierarchies.
- Pleiades, a community gazetteer of ancient places.
- The World Historical Gazetteer, which focuses on places over time and links records across sources.
- Library of Congress authorities, which many catalogs already use for geographic headings.
Automatic geocoders are helpful for a first pass, especially on large collections. They also make predictable mistakes. A name like Springfield or Athens matches dozens of places. A historical name may match a modern town that did not exist then. Plan for human review of anything the machine was not confident about.
Recording uncertainty honestly
A map pin implies precision. Often the evidence does not support it. A caption might say "near the river" or "somewhere in the county." A port might be known only by a name that changed spelling three times. If you force each of these to a single point, the map lies.
Record the level of certainty alongside the location. A simple scheme works well.
| Precision | Example | How to display |
|---|---|---|
| Exact | A named building with a known address | Point marker |
| Settlement | A town or city | Point at the town center, labeled as approximate |
| Region | A county, state or coastline | Shaded area instead of a point |
| Uncertain | Conflicting or vague evidence | Listed but not mapped, or mapped with a clear flag |
In a spreadsheet or database, that means a handful of columns for each place reference: the record identifier, the original text, a normalized name, a gazetteer URI, latitude and longitude, a precision level and a note. It is a small structure. It is also enough to drive search facets, a map layer and a later upgrade to linked data without redoing the work.
Keep the original wording from the source next to the normalized place. Researchers want to see both. The normalized value supports search. The original preserves the evidence.
Time matters as much as space. Borders, place names and even coastlines change. A record that pairs a place with a date range is far more useful than one that pairs it with a modern country name.
Simple map interfaces
You do not need a full geographic information system to publish a useful map. Most collection maps need three things: a base map, a layer of points or areas, and a link from each feature back to the catalog record.
GeoJSON is the usual format for that layer. It is a plain JSON structure, standardized as RFC 7946 in 2016, and nearly every web mapping library reads it. Leaflet is a lightweight open source library that displays GeoJSON over a tiled base map, often from OpenStreetMap. Exporting your geocoded records to GeoJSON and loading them into a small Leaflet page is a weekend project, not a grant proposal.
A few design habits help:
- Cluster dense points so the map stays readable at a regional zoom level.
- Show the approximate ones differently from the exact ones.
- Offer a list view next to the map. Not every reader can use a map, and screen reader users need a text path to the same records.
- Link every marker to a stable record URL, not to a search result.
Accessibility deserves a word on its own. Interactive maps are hard to use with a keyboard and harder with a screen reader. Make sure the map can be skipped, that markers have readable labels, and that every filter on the map also works on the list. If a reader cannot see the map at all, they should still reach every record it shows.
Maps as scholarly argument
A map is never neutral. It chooses a projection, a base layer, a time frame and what to leave out. In digital humanities work, those choices are part of the argument and should be documented.
The Trans-Atlantic Slave Trade Database project, which the MetaScholar Initiative supported at Emory, is an instructive case. It combined voyage data with maps and archival documents so that researchers and general readers could see the routes and scale of forced migration. Our piece on lessons from the Slave Voyages database looks at how data, maps and editorial review worked together there. The lesson for smaller projects is clear. Mapped data needs an editorial process, a way to correct errors and a statement of what the map does and does not show.
First steps for a mapping project
Start with one collection that has strong place information. Extract every place term into a spreadsheet with the record identifier and the original wording. Reconcile names against a gazetteer, add an identifier and a precision level, and review the hard cases by hand. Export to GeoJSON and build the simplest map that links back to your records.
Then publish your method alongside the map. Note which gazetteer you used, how you handled uncertainty and what you excluded. That short note turns a pretty interface into a trustworthy research tool, and it makes the next collection faster to map.